The cross averaging effect is a strategy that aims to reduce the impact of volatility on asset purchases.
Typically an investor might purchase a large amount of cryptocurrency a few times a year or once a month. This can lead to investors buying cryptocurrency at inopportune times where prices are higher than average. Our cross averaging effect flow breaks down what may normally have been a single larger purchase into multiple smaller purchases by buying the smallest amount of cryptocurrency possible at random times around the clock. Such an approach ensures that users pay an average price for their crypto close to the average actual price of the market.
The impact of volatility is somewhat reduced in that as the cross averaging effect strategy buys frequently; users tend to purchase crypto at both high prices and low prices. Over time, the price paid averages itself out and investors can be assured of paying close to the average market price for a crypto over a given time period. Buying cryptocurrency infrequently runs the risk of potentially buying at only higher than average prices over any given time period, leading to investors potentially incurring heavier losses.
Naturally, cryptocurrencies are notorious for being volatile assets anyway, and there is always a chance that one could perform a single large purchase at a record low price. However, employing the cross averaging effect is a sensible approach to investing that negates the risk of buying at inopportune times. Furthermore, as exchange fees are percentage based, it should be noted that there should be no significant differences in fees incurred by employing the cross average effect versus a single larger transaction.
To demonstrate the cross average effect, we ran a simulated trading environment several hundred times for random time periods between January 2018 and March 2022. For each random time period we employ both a cross average effect flow to purchase Bitcoin with Euros and a simple flow that purchases Bitcoin with Euros randomly approximately every 30 days during the same time period. We then calculate and plot the difference between the average price paid for the Bitcoin and the average actual price of Bitcoin during the random time period. The plot [box plot]clearly demonstrates that by employing the cross average buying flow, bitcoin is purchased closer to the actual market value for any given time period than when buying monthly. The box plot displays a much larger spread in values for the multiple randomly simulated buying monthly flows, we could indeed have gotten lucky for a certain time period and paid less than the actual average price of Bitcoin, but conversely we could also have been unlucky and paid significantly more than the average actual price for Bitcoin. With the cross average effect, we would have no such worries.
It is important to note that with a basic implementation, deploying the cross averaging effect flow does not offer better or worse expected returns compared to an infrequent buying approach. It is simply a strategy to decrease volatility; the cross averaging effect flow does not care when we purchase crypto, only to purchase frequently and randomly. What if there was some additional data or signal we could employ, in combination with the cross averaging effect, to not only mitigate some volatility when purchasing Bitcoin but also to purchase Bitcoin at better prices? How could we pay less for our Bitcoin, and buy during lows and avoid price peaks? Such an approach would potentially offer better expected returns than a random buying approach.
This is where the Crypto Fear & Greed Index comes in!
The Crypto Fear & Greed Index is a signal for the overall crypto market that attempts to quantify market sentiment and emotion. The index gathers data from multiple sources, including Social Media, Google Trends, and Volatility data to produce a signal integer to quantify whether the crypto market is feeling more fearful or greedy on a particular day.
We again ran a simulated trading environment several hundred times for random time periods between January 2018 and March 2022. For each time period we calculate the average actual price of the market as well as run our cross average effect flow. This time however, we only purchase Bitcoin is the Fear & Greed Crypto Index for that specific day is indicating that the current emotion is fearful. The logic here is that during Greedy time periods, crypto prices are likely to be higher but during Fearful time periods, crypto prices may be some what lower. Our results demonstrate that, after simulating this approach several hundred times, using the cross average effect in conjunction with the fear and greed index, we can expect to pay 15% less on average for our Bitcoin compared to the average actual bitcoin price! The cross average effect flow in conjunction with the fear and greed index paid less than the mean actual Bitcoin price during the simulated time period in 94% of all simulations!
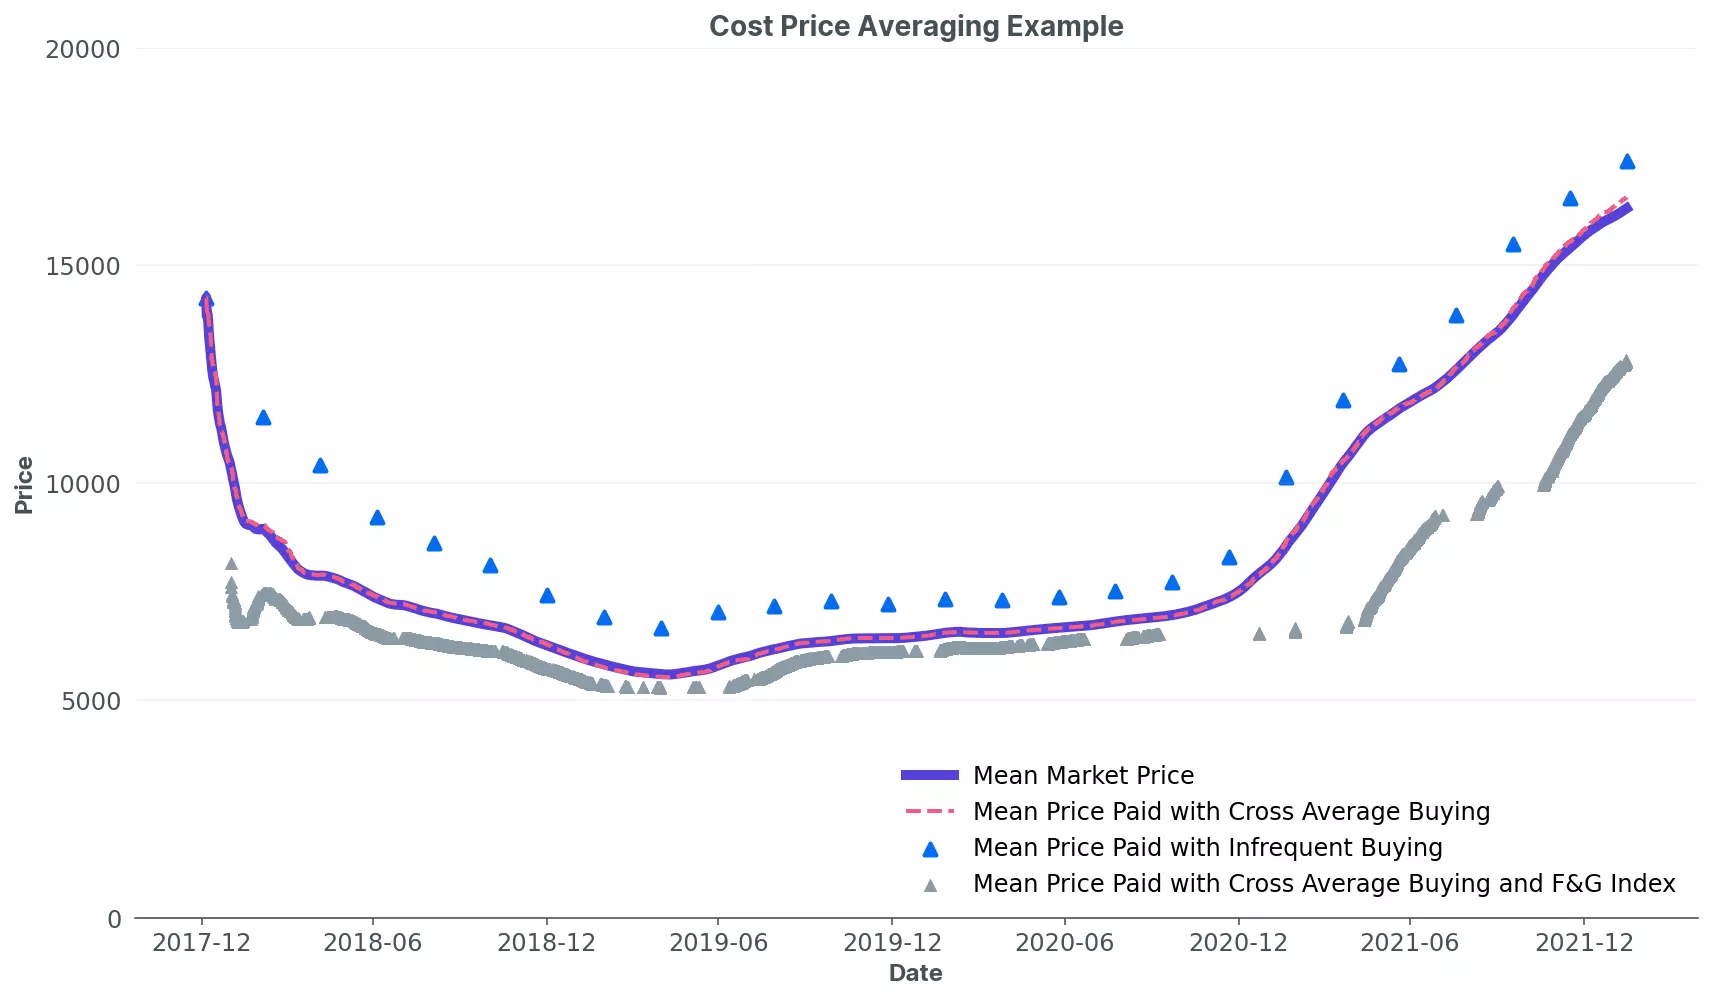
The cross price average example graph summarizes all key topics quite neatly. We run a single simulation for all strategies for a time period from December 2017 until December 2021. The graph displays the rolling mean price of Bitcoin in Euros during this time period. The rolling mean price paid for Bitcoin using just the cross average buying strategy is also plotted and can be seen to hug the mean actual market price. This is exactly how we expect the strategy to work! We can be sure of paying close to the actual market price for Bitcoin with this strategy over time. The rolling mean price paid for Bitcoin when buying with an infrequent buying strategy is also displayed. Here we can see that we have been unfortunate as we have bought Bitcoin at inopportune times and this leads us to having a mean price paid as being above the actual market price. Volatility of our Bitcoin assets is thus exacerbated in that as we have paid more for our Bitcoin; as the price falls, our losses are larger than they could have been had we deployed the cross average effect strategy. Finally, we plot of the rolling mean price paid for Bitcoin with the cross average buying in conjunction with the Fear and Greed index strategy. In this example, we can see that throughout the entire time frame, we are consistently paying less than the average price for Bitcoin! What is interesting about this plot is that we can see that there are periods in the time frame when this strategy does not purchase any Bitcoin. This is because the fear and greed index is indicating a ‘Greedy’ sentiment towards Bitcoin during these dates and as such our flow does not purchase. Overlaying a plot of the price points where we purchase Bitcoin with our cross average fear & greed strategy with a plot of the actual Bitcoin price, we can see that our strategy nicely avoids buying Bitcoin at peak prices (as this normally coincides with ‘Greedy’ sentiment)!
The only potential disadvantage of using the cross average fear and greed strategy is that during longer ‘Greedy’ time frames, the strategy refuses to purchase any Bitcoin. Thus if one wants to quickly accumulate Bitcoin it is perhaps not the most appropriate strategy. But for longer term investing it is certainly an interesting proposition. Binance offers a service similar to the cross average effect flow (known as ‘ Binance Recurring Buy’). This services is however only available on Binance and only accepts credit card payments, whereas on Foretale any market on any exchange can be used. Further more this service is not available in conjunction with any other signals, such as the fear and greed index.
| Foretale - Cross Average Buying | Binance Recurring Buying | |
|---|---|---|
| Supported exchanges | Any exchange | Only Binance |
| Supported markets | Any market | Only via credit card |
| Highest frequency | As low as once per minute | Only once per week on a fixed day |